Geographic Information Systems (GIS) and Spatial Analytics
The evidence is clear: place matters.
Examples of what GIS can do:
- Conduct analyses based on geographic areas (e.g., census tracts).
- Integrate geographic area outcomes with individual or institutional-level outcomes.
- Measure geographic accessibility.
- Specify how best to allocate resources to maximize access and map disparities.
The places where individuals live, learn, and work can have a dramatic impact on their opportunities and life outcomes. These place effects—the advantages and disadvantages that one inherits by simply living in a particular location—are the result of unequal access to resources and opportunities across multiple overlapping sectors, such as education, health care, food, housing, transportation, and employment.
Policies and programs must account for the effects of place to achieve their desired impact.
The Geographic Information System (GIS) Team at AIR supports place-based leadership and decision-making through:
- Interactive mapping applications
- Customized mapping dashboards
- Simple “Story Maps” to share findings and insights
- Static mapping and spatial infographics
- Sophisticated spatial analytics and remote sensing
The GIS team is proficient in a wide variety of geospatial analysis software including Tableau, ArcGIS Online, ArcGIS Enterprise, ArcGIS Pro, Salesforce, Power Query, Power BI, Apache Superset, and Custom JavaScript Solutions.
Our Work
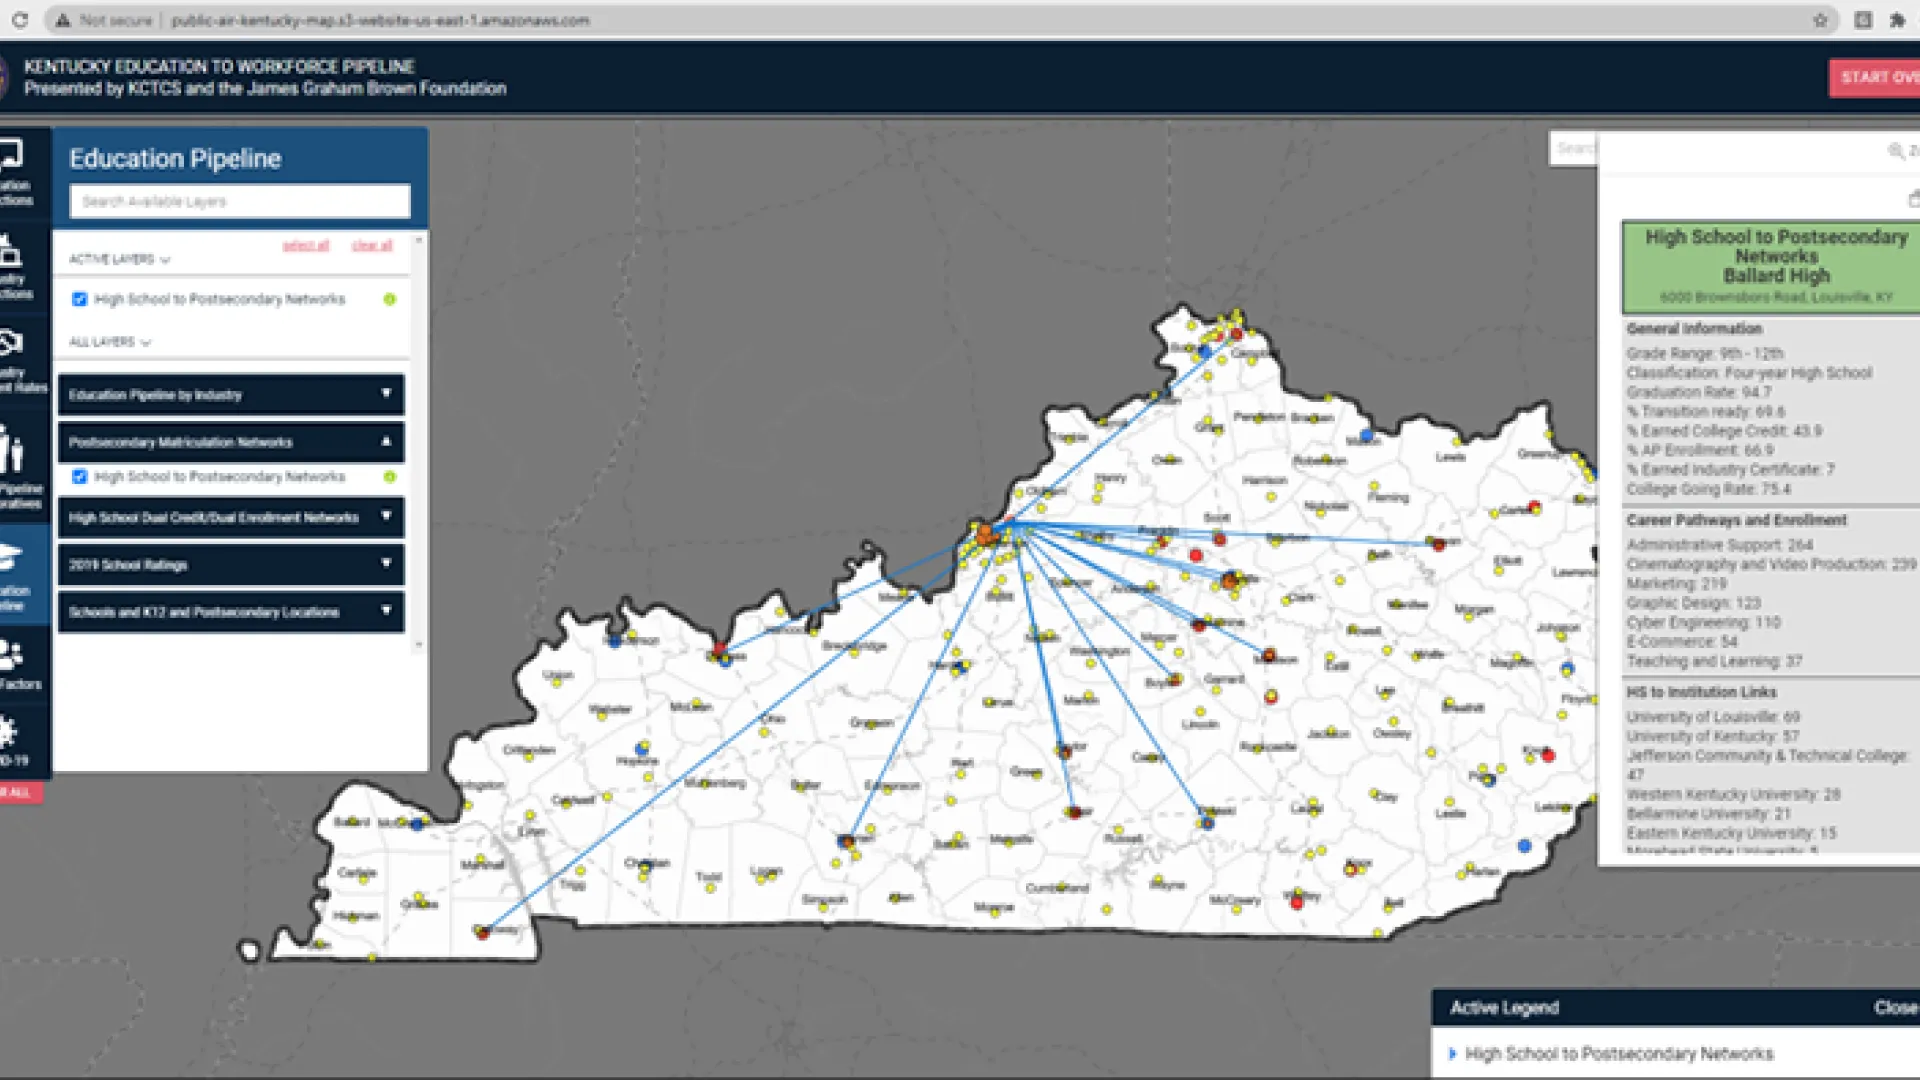
Kentucky Education to Workforce Mapping Application (2020-2022)
AIR collaborated with the Kentucky Community and Technical College System (KCTCS) to examine the education to workforce program alignment and its equitability across the state by creating a fully customized online application. We mapped education, industry, and wage data, as well as additional important social determinants of health, in order to explore opportunity gaps among students. Network visualizations showing graduate movement from high school to specific industry programs in the state’s colleges and universities were also created to help close workforce gaps across the state. This application will inform KCTCS’s development of academic programs and resources to align with workforce needs.
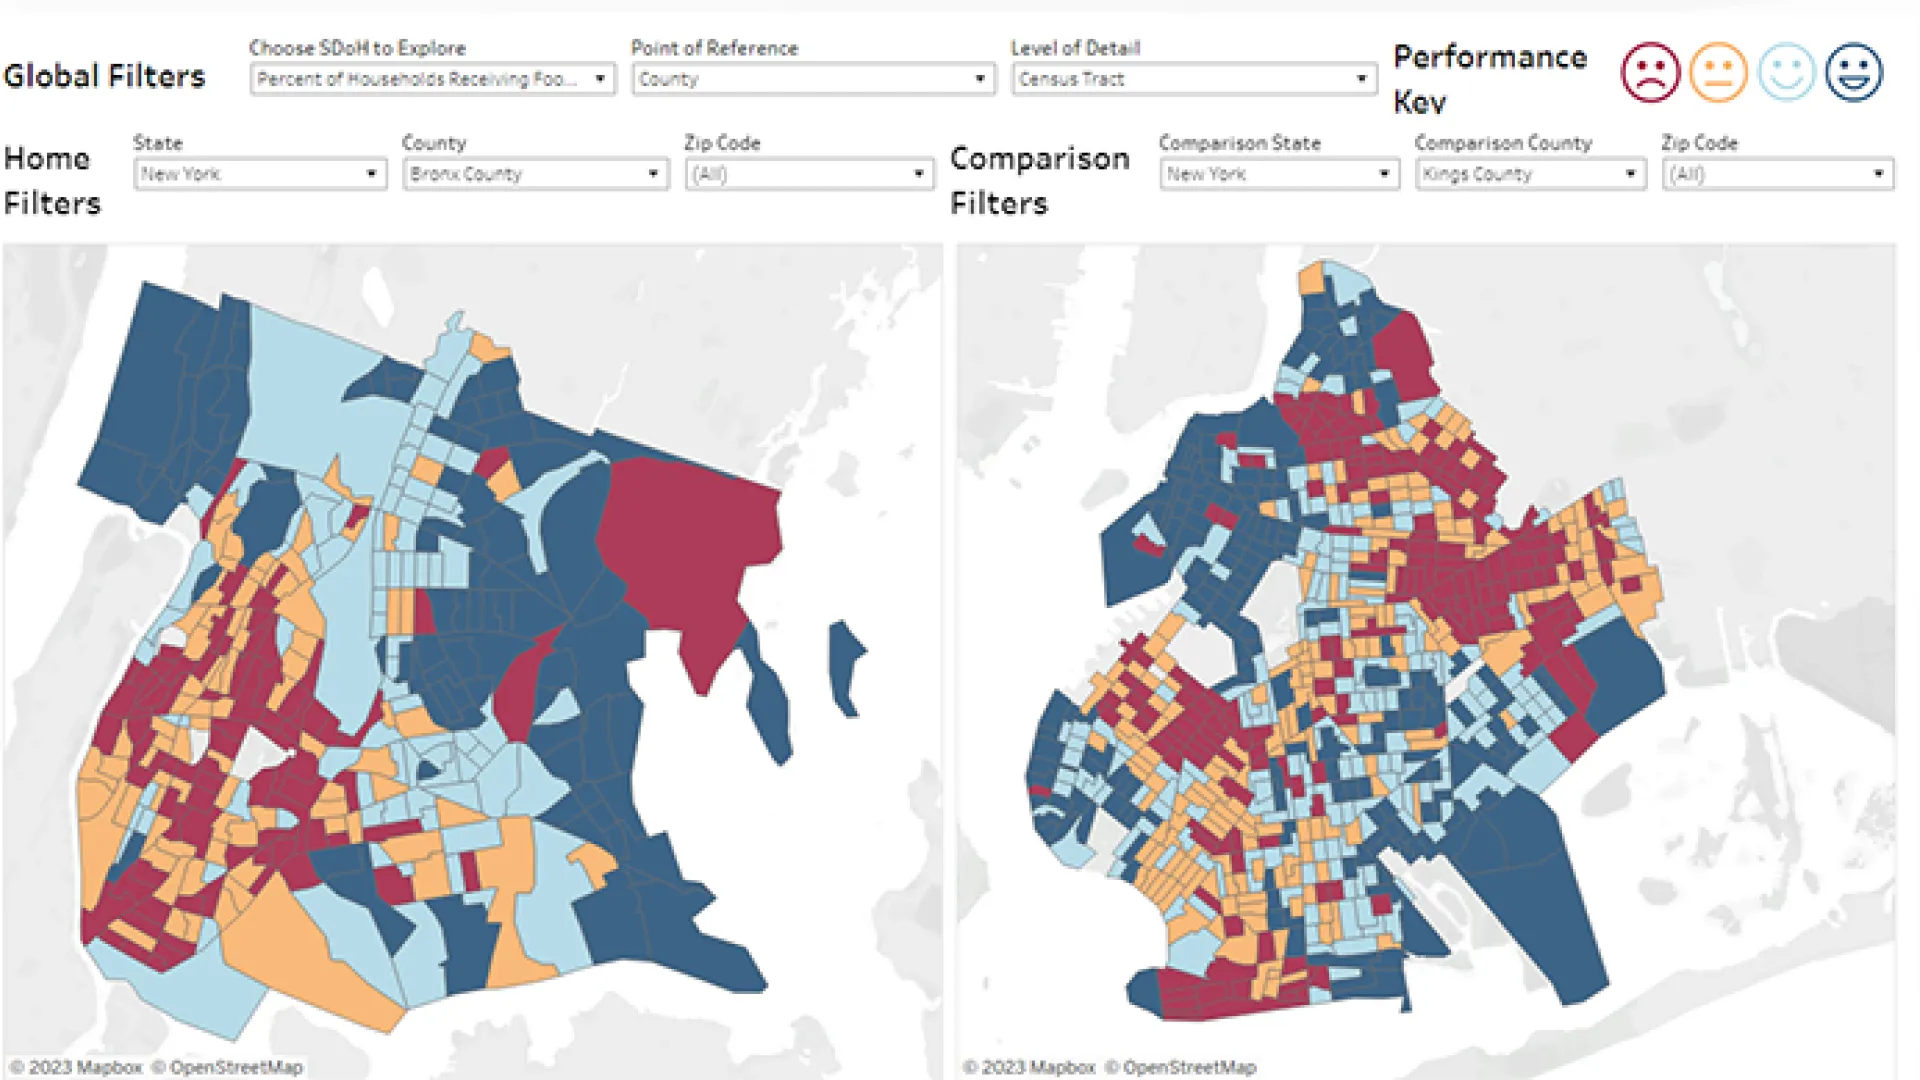
Social Determinants of Health (SDoH) Dashboard Action Tool (2019)
The SDoH Dashboard Action Tool, named a semifinalist in the Agency for Healthcare Research and Quality (AHRQ) Visualization Resources of Community-Level SDoH Challenge, was created and is maintained using Tableau. The tool includes a comprehensive database containing linked health care measure data (e.g., CMS MMD) with free and publicly available SDoH datasets (e.g., ACS, Opportunity Atlas) and include data at the census tract level, enabling community-level analysis.
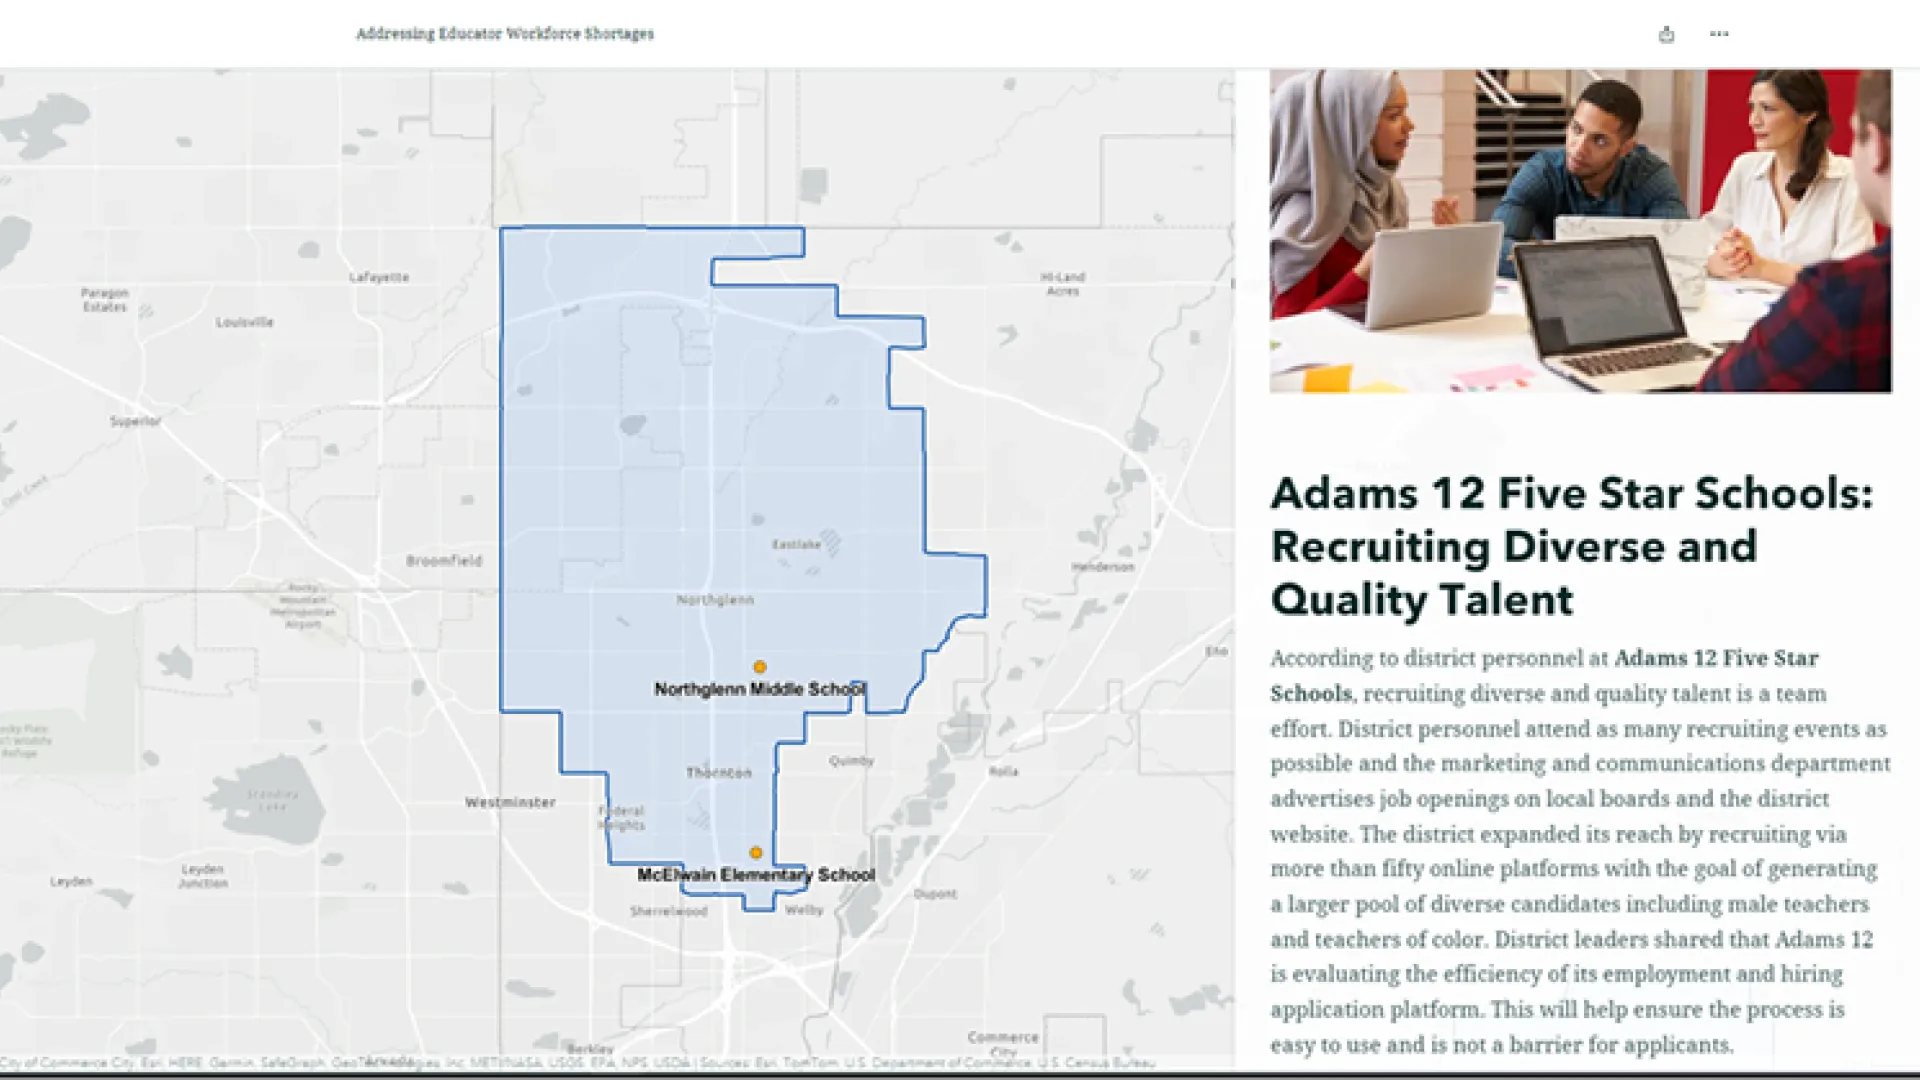
Addressing Educator Workforce Shortages: Colorado Bright Spots Story Map (2021-2022)
AIR collaborated with the Colorado Department of Education (CDE) to create a story map that explores strategies leveraged by Colorado districts and schools to recruit and retain effective educators. The story map identifies “Colorado Bright Spots” or schools with strong teacher retention rates despite factors typically associated with lower retention rates.